
At a Glance
Who we are

bank in North America by assets
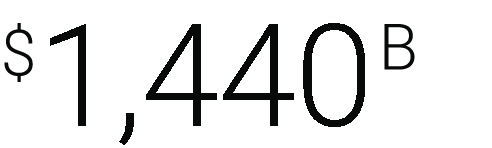
in total assets

serving customers for
207 years and counting
Three operating groups
Personal and
Commercial Banking
BMO Wealth
Management
BMO Capital
Markets
As at April 30, 2025.

Q2 2025 corporate fact sheet (PDF, 125 KB)
Financial Performance
| Medium-term objectives1 | 2024 financial performance | 3-year3 financial performance | |||||
|---|---|---|---|---|---|---|---|
| Reported | Adjusted2 | Reported | Adjusted2 | ||||
| EPS growth of 7% to 10% | 65.1% | (18.0)% | (6.3)% | (9.3)% | |||
| ROE of 15% or more | 9.7% | 9.8% | 12.9% | 12.5% | |||
| ROTCE of 18% or more | 13.5% | 13.1% | 15.7% | 15.3% | |||
| Operating leverage2 of 2% or more | 19.8% | 1.6% | 0.4% | (1.3)% | |||
| Capital ratios that exceed regulatory requirements | 13.6% CET1 Ratio4 | na | |||||
A 196-year dividend record
BMO Financial Group has the longest-running dividend payout record of any company in Canada, at 196 years. BMO common shares had an annual dividend yield of 4.8% at October 31, 2024.


1 We have established medium-term financial objectives for certain important performance measures. Medium-term is generally defined as three to five years, and performance is measured on an adjusted basis.
2 Prior to November 1, 2022, we presented adjusted revenue on a basis net of insurance claims, commissions and changes in policy benefit liabilities (CCPB) and operating leverage was calculated based on revenue, net of CCPB. Beginning fiscal 2023, we no longer report CCPB, given the adoption and retrospective application of IFRS 17, Insurance Contracts (IFRS 17). Revenue, net of CCPB, was $34,393 million in fiscal 2022 and $25,787 million in fiscal 2021. Measures and ratios presented on a basis net of CCPB are non-GAAP amounts. For further information, see the Non-GAAP and Other Financial Measures section of Management’s Discussion and Analysis (MD&A). Regarding the composition of non-GAAP and other financial measures, including supplementary financial measures, refer to the Glossary of Financial Terms in the MD&A.
3 The 3-year EPS growth rate and operating leverage, net of CCPB, reflect compound annual growth rates (CAGR).
4 The CET1 Ratio is disclosed in accordance with OSFI’s Capital Adequacy Requirements (CAR) Guideline.
5 As of October 31, 2024.
6 Percentages determined excluding results in Corporate Services.
Certain comparative figures have been reclassified to conform with the current year’s presentation.
Bank of Montreal brands the organization’s member companies as BMO Financial Group. Note 27 of the consolidated financial statements lists the intercorporate relationships among Bank of Montreal and its significant subsidiaries.
Investor relations
Stay up to date with our quarterly results, investor events, shareholder information and other key resources.


Corporate governance
Good corporate governance matters to our shareholders, our customers, our employees – and to us.